Market multiples at a glance

I. The transactional environment

The environment for corporate transactions in Switzerland

Trading volume (published) in Switzerland :

  • Generally speaking, the relatively stable political framework and business climate contribute to a high level of investor confidence. Social regulations are flexible for entrepreneurs, and tax and interest rates are generally competitive with neighbouring countries.

  • Switzerland confirms its status as a «key player»In terms of technological innovation, a sector that has played a crucial role in the Group's business activities, the Group has played a key role. M&A in recent years and continues to show promising prospects for the future. In particular, the country is cultivating its lead in high value-added businesses. The success of Swiss companies is due in particular to their highly qualified human capital.

  • In 2024, 519 corporate transactions were announced in Switzerland, a slight increase on 2023, when 509 transactions were reported. However, this volume of announced transactions is down on 2022 (591 published transactions), which was a record year due in particular to a rebound effect following Covid-19.

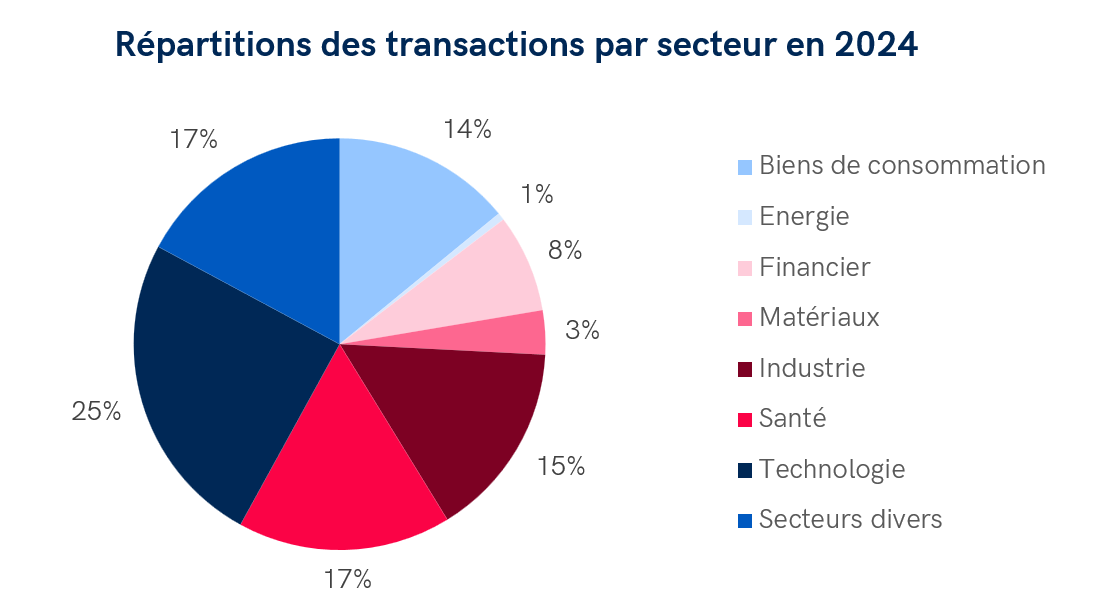
  • The M&A market in 2024 is likely to be dominated by the technology sector, with 138 deals reported. It is followed by the healthcare and industrial sectors, with 94 and 89 deals respectively announced by 31 December 2024.
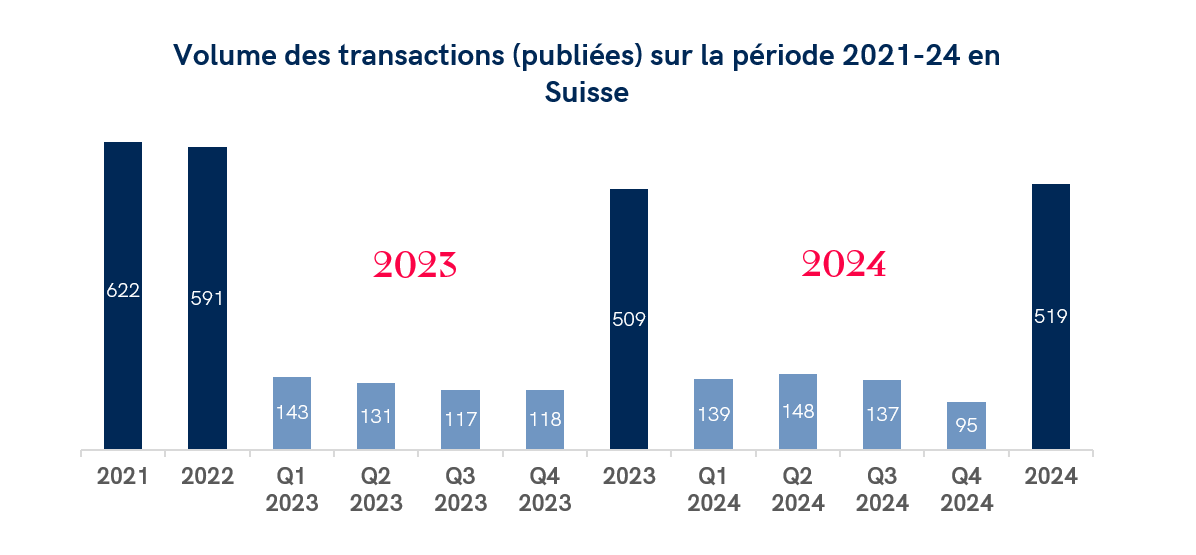
Graph showing the volume of corporate transactions published in Switzerland between 2021 and 2024. Annual volumes show a gradual decline from 622 in 2021 to 519 in 2024, with the exception of 2023 when transactions reached 509. Quarterly data are also presented for 2023 and 2024.
Pie chart showing the breakdown of transactions by sector in Switzerland in 2024. Technology dominates with 25 % of deals, followed by healthcare (17 %), miscellaneous (17 %), industry (15 %), consumer goods (14 %), materials (8 %), financials (3 %) and energy (1 %).

Source : Refinitiv

II. Sector summary at a glance«

The multiples presented below are based on the following criteria: public companies; geographical sector (Switzerland and Western Europe). Unrepresentative stocks have generally been excluded from these analyses. (Source : Refinitiv).

EV (Enterprise value): enterprise value excluding free cash flow and/or debt

Energy sector

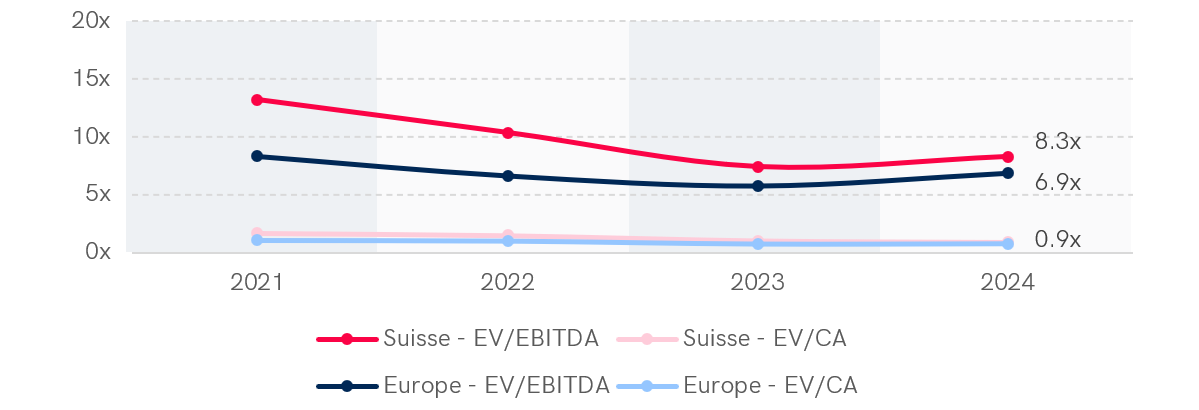
Median multiples in Switzerland and Western Europe over 4 years
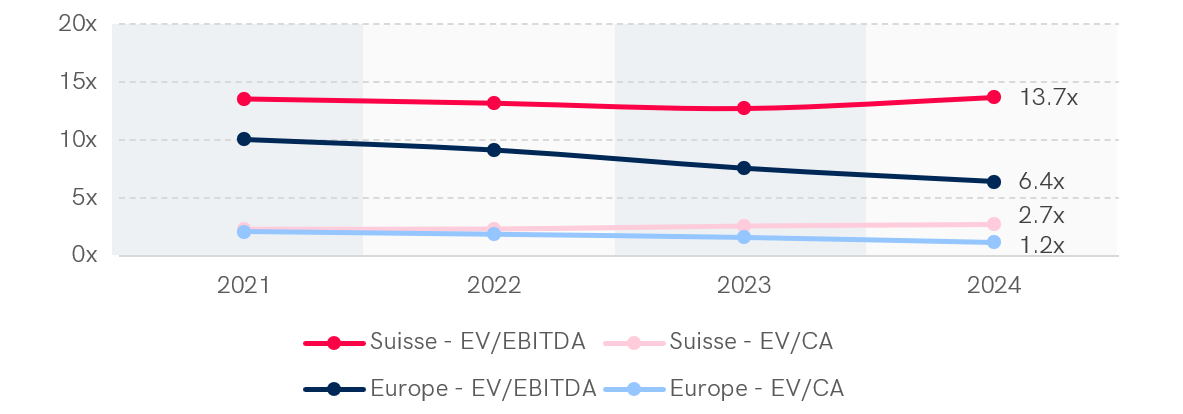
Graph showing the median EV/EBITDA and EV/CA multiples in the energy sector in Switzerland and Western Europe over 4 years (2021-2024). In 2024, Switzerland shows an EV/EBITDA multiple of 13.7x and EV/CA of 2.7x, while Western Europe reaches 6.4x for EV/EBITDA and 1.2x for EV/CA. The data show a stable trend in Switzerland, while multiples in Western Europe are declining slightly.
Energy

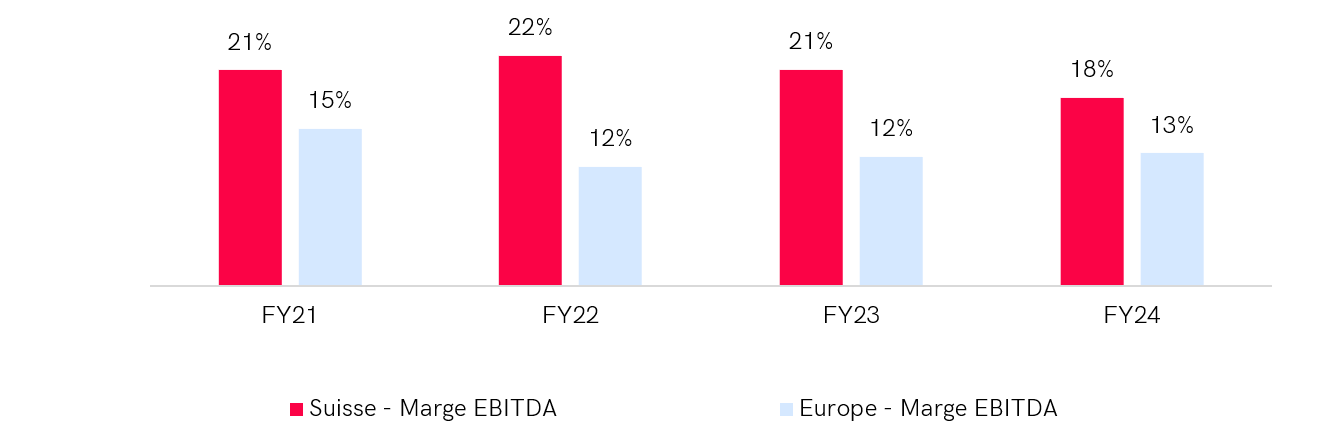
Economic profitability in Switzerland and Western Europe over 4 years
Graph comparing economic profitability in the energy sector between Switzerland and Western Europe over 4 years (FY21-FY24). In 2024, the EBITDA margin is 18 % in Switzerland, compared with 13 % in Western Europe. Switzerland maintains a higher EBITDA margin each year, peaking at 22 % in 2022, while Western Europe fluctuates between 12 % and 15 %.

Materials sector

Median multiples in Switzerland and Western Europe over 4 years
Graph showing median EV/EBITDA and EV/CA multiples in the materials sector in Switzerland and Western Europe over 4 years (2021-2024). In 2024, Switzerland shows an EV/EBITDA multiple of 8.3x and EV/CA of 0.9x, while Western Europe reaches 6.9x for EV/EBITDA and remains stable at 0.9x for EV/CA. The EV/EBITDA multiples show a decline until 2023, followed by a slight recovery in 2024.

Materials

Economic profitability in Switzerland and Western Europe over 4 years

Graph comparing economic profitability in the materials sector between Switzerland and Western Europe over 4 years (FY21-FY24). In 2024, the EBITDA margin in Switzerland is 15 %, while it is 12 % in Western Europe. Switzerland maintains higher EBITDA margins each year, reaching a peak of 17 % in 2022, while European margins vary between 12 % and 14 %.

Industry sector

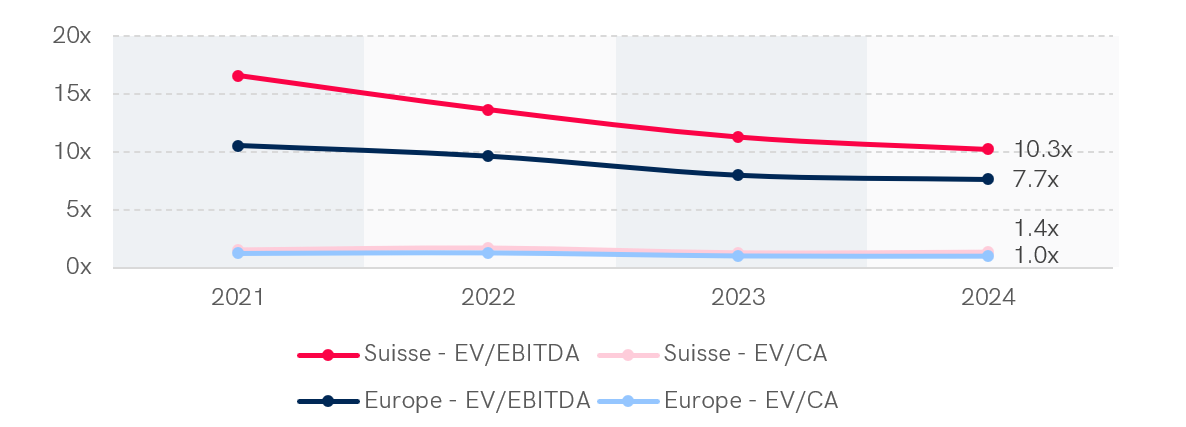
Median multiples in Switzerland and Western Europe over 4 years

Graph showing the median EV/EBITDA and EV/CA multiples in the industrial sector in Switzerland and Western Europe over 4 years (2021-2024). In 2024, Switzerland has an EV/EBITDA multiple of 10.3x and EV/CA of 1.4x, while Western Europe has 7.7x for EV/EBITDA and 1.0x for EV/CA. EV/EBITDA multiples showed a downward trend over the period in both regions.

Industry

Economic profitability in Switzerland and Western Europe over 4 years

Graph comparing economic profitability in the materials sector between Switzerland and Western Europe over 4 years (FY21-FY24). In 2024, the EBITDA margin in Switzerland is 15 %, while it is 12 % in Western Europe. Switzerland maintains higher EBITDA margins each year, reaching a peak of 17 % in 2022, while European margins vary between 12 % and 14 %.

Health sector

Median multiples in Switzerland and Western Europe over 4 years
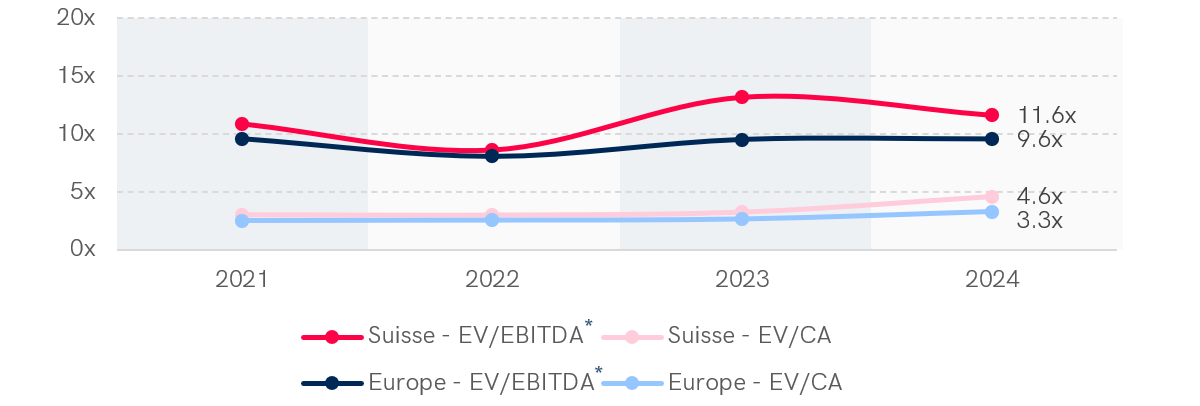
Graph showing the median EV/EBITDA and EV/CA multiples in the industrial sector in Switzerland and Western Europe over 4 years (2021-2024). In 2024, Switzerland has an EV/EBITDA multiple of 10.3x and EV/CA of 1.4x, while Western Europe has 7.7x for EV/EBITDA and 1.0x for EV/CA. EV/EBITDA multiples showed a downward trend over the period in both regions.
Health

Economic profitability in Switzerland and Western Europe over 4 years

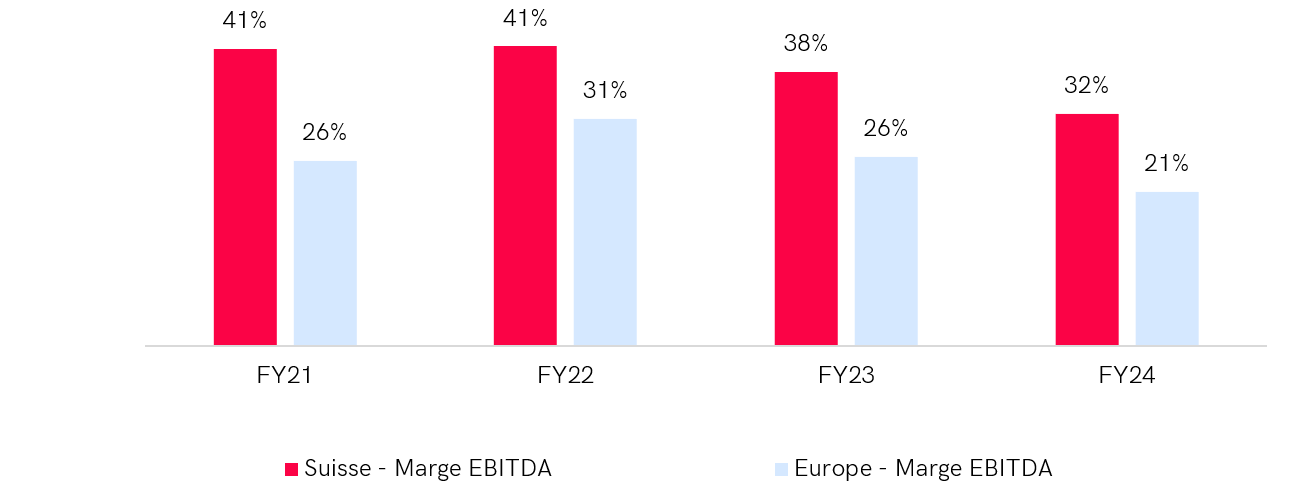
Graph comparing economic profitability in the materials sector between Switzerland and Western Europe over 4 years (FY21-FY24). In 2024, the EBITDA margin in Switzerland is 15 %, while it is 12 % in Western Europe. Switzerland maintains higher EBITDA margins each year, reaching a peak of 17 % in 2022, while European margins vary between 12 % and 14 %.

Recurring consumer goods sector

Median multiples in Switzerland and Western Europe over 4 years
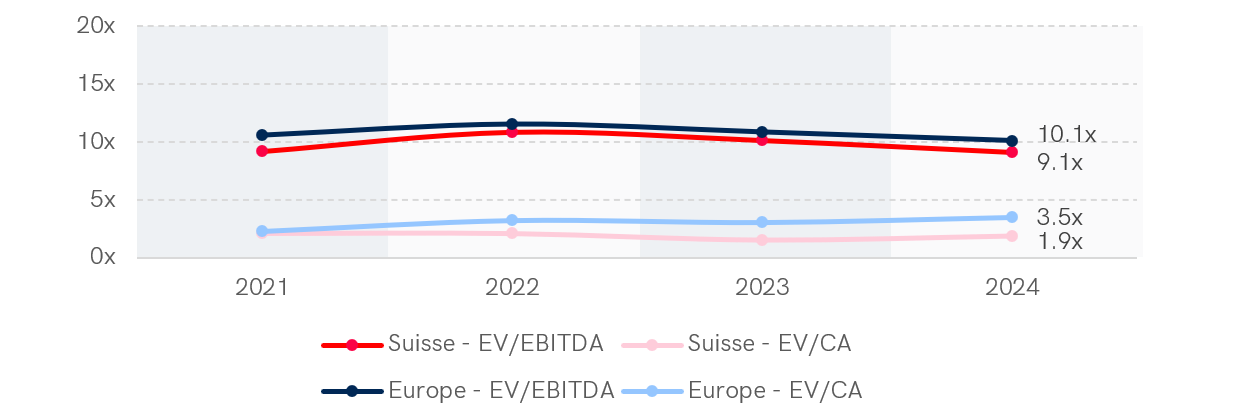
Graph showing the median EV/EBITDA and EV/CA multiples in the industrial sector in Switzerland and Western Europe over 4 years (2021-2024). In 2024, Switzerland has an EV/EBITDA multiple of 10.3x and EV/CA of 1.4x, while Western Europe has 7.7x for EV/EBITDA and 1.0x for EV/CA. EV/EBITDA multiples showed a downward trend over the period in both regions.
Recurring consumer goods

Economic profitability in Switzerland and Western Europe over 4 years

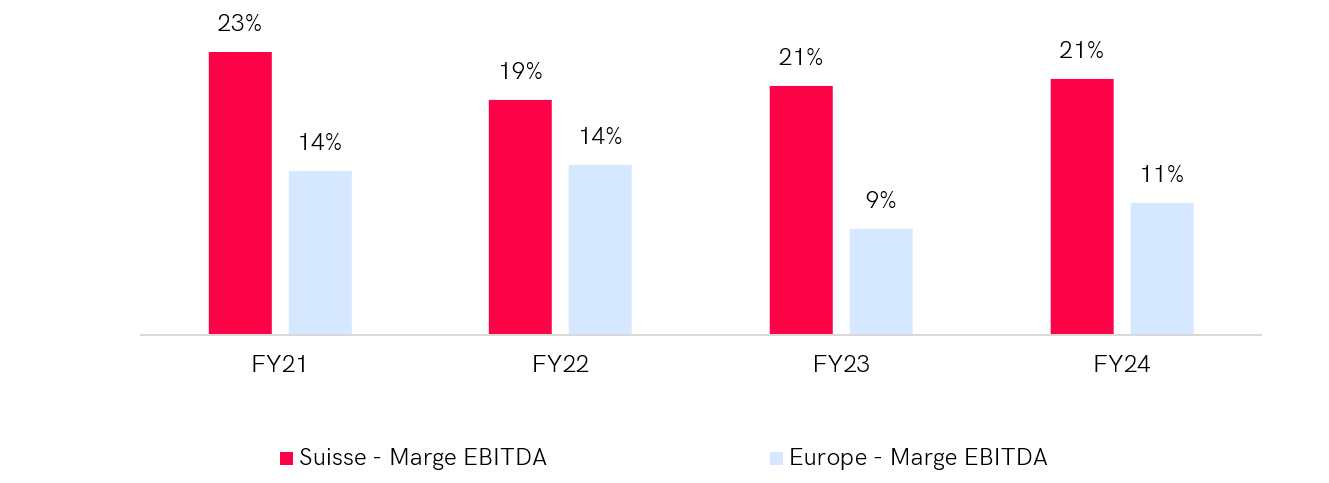
Graph comparing economic profitability in the materials sector between Switzerland and Western Europe over 4 years (FY21-FY24). In 2024, the EBITDA margin in Switzerland is 15 %, while it is 12 % in Western Europe. Switzerland maintains higher EBITDA margins each year, reaching a peak of 17 % in 2022, while European margins vary between 12 % and 14 %.

Occasional consumer goods sector

Median multiples in Switzerland and Western Europe over 4 years

Graph showing the median EV/EBITDA and EV/CA multiples in the industrial sector in Switzerland and Western Europe over 4 years (2021-2024). In 2024, Switzerland has an EV/EBITDA multiple of 10.3x and EV/CA of 1.4x, while Western Europe has 7.7x for EV/EBITDA and 1.0x for EV/CA. EV/EBITDA multiples showed a downward trend over the period in both regions.

Occasional consumer goods

Economic profitability in Switzerland and Western Europe over 4 years

Graph comparing economic profitability in the materials sector between Switzerland and Western Europe over 4 years (FY21-FY24). In 2024, the EBITDA margin in Switzerland is 15 %, while it is 12 % in Western Europe. Switzerland maintains higher EBITDA margins each year, reaching a peak of 17 % in 2022, while European margins vary between 12 % and 14 %.

Financial sector

Median multiples in Switzerland and Western Europe over 4 years

Graph showing the median EV/EBITDA and EV/CA multiples in the industrial sector in Switzerland and Western Europe over 4 years (2021-2024). In 2024, Switzerland has an EV/EBITDA multiple of 10.3x and EV/CA of 1.4x, while Western Europe has 7.7x for EV/EBITDA and 1.0x for EV/CA. EV/EBITDA multiples showed a downward trend over the period in both regions.

Finance

Economic profitability in Switzerland and Western Europe over 4 years

Graph comparing economic profitability in the materials sector between Switzerland and Western Europe over 4 years (FY21-FY24). In 2024, the EBITDA margin in Switzerland is 15 %, while it is 12 % in Western Europe. Switzerland maintains higher EBITDA margins each year, reaching a peak of 17 % in 2022, while European margins vary between 12 % and 14 %.

Technology sector

Median multiples in Switzerland and Western Europe over 4 years

Graph showing the median EV/EBITDA and EV/CA multiples in the industrial sector in Switzerland and Western Europe over 4 years (2021-2024). In 2024, Switzerland has an EV/EBITDA multiple of 10.3x and EV/CA of 1.4x, while Western Europe has 7.7x for EV/EBITDA and 1.0x for EV/CA. EV/EBITDA multiples showed a downward trend over the period in both regions.

Technologies

Economic profitability in Switzerland and Western Europe over 4 years

Graph comparing economic profitability in the materials sector between Switzerland and Western Europe over 4 years (FY21-FY24). In 2024, the EBITDA margin in Switzerland is 15 %, while it is 12 % in Western Europe. Switzerland maintains higher EBITDA margins each year, reaching a peak of 17 % in 2022, while European margins vary between 12 % and 14 %.

Service sector

Median multiples in Switzerland and Western Europe over 4 years

Graph showing the median EV/EBITDA and EV/CA multiples in the industrial sector in Switzerland and Western Europe over 4 years (2021-2024). In 2024, Switzerland has an EV/EBITDA multiple of 10.3x and EV/CA of 1.4x, while Western Europe has 7.7x for EV/EBITDA and 1.0x for EV/CA. EV/EBITDA multiples showed a downward trend over the period in both regions.

Services

Economic profitability in Switzerland and Western Europe over 4 years

Graph comparing economic profitability in the materials sector between Switzerland and Western Europe over 4 years (FY21-FY24). In 2024, the EBITDA margin in Switzerland is 15 %, while it is 12 % in Western Europe. Switzerland maintains higher EBITDA margins each year, reaching a peak of 17 % in 2022, while European margins vary between 12 % and 14 %.

III. Outlook


Confirmed recovery in transaction activity

1. Gradual recovery

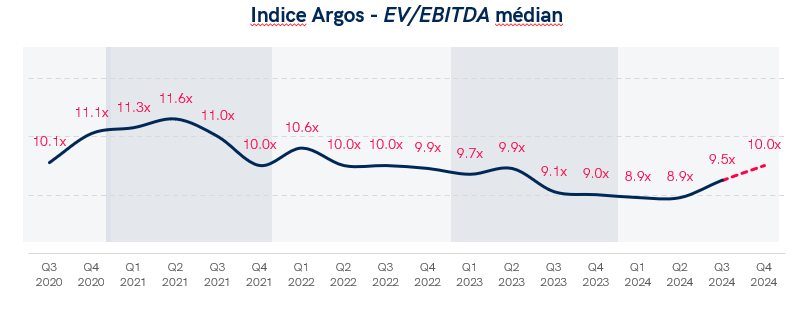
        • L’Argos Index® is a quarterly index that measures the valuation of unlisted mid-market(1) SMEs in the eurozone, based on transaction multiples. Launched in 2006 by Argos Wityu and Epsilon Research, it presents the median of the historical EV/EBITDA multiple over six «rolling» months.
        • Valuation differentials are gradually narrowing, with multiples becoming less polarised and extremes becoming rarer, reflecting an apparent stabilisation in the market.
        • The gap between the multiples paid by private equity funds and strategic buyers is now 1.3x EBITDA, confirming a post-Covid structural change. Between 2004 and 2020, strategic buyers were occasionally paying higher multiples than private equity funds (0.2x more). Since 2021, these funds have been paying 0.9x more on average, thanks to the availability of capital and the low cost of debt.

2. New opportunities

        • Private equity funds focus on quality assets, willing to pay premiums despite a relatively uncertain macroeconomic environment.
        • Opportunities seem to be developing in sectors such as energy, infrastructure and insurance.
        • Investors are adopting diversified strategies, including private club deals and tailored bank debt (acquisition debt).
Graph comparing economic profitability in the materials sector between Switzerland and Western Europe over 4 years (FY21-FY24). In 2024, the EBITDA margin in Switzerland is 15 %, while it is 12 % in Western Europe. Switzerland maintains higher EBITDA margins each year, reaching a peak of 17 % in 2022, while European margins vary between 12 % and 14 %.

Source: Argos Wityu (20.11.2024). Argos Index® 3rd Quarter 2024.

Sources :

  1. Mid-market: refers to medium-sized companies, with an enterprise value generally between MEUR 15 and MEUR 500. 

Latest news

Annual VAT reconciliation

Annual VAT reconciliation

Annual VAT reconciliation is compulsory for all taxable businesses in Switzerland. Find out why it's essential, what the deadline is and how our experts can help you avoid errors and penalties.

read more

The Corporate Finance department of Berney Associés will be happy to answer any questions you may have on the subject of this article. Please do not hesitate to contact us!