Market multiples at a glance

I. The transactional environment
The environment for corporate transactions in Switzerland
Context and volume of transactions in French-speaking Estimations :
- In 2025, the reinforcement of the United States' protectionist trade policy, marked by fluctuating customs duty impositions against several trading partners, including Switzerland, intensified the climate of uncertainty. This context weighed on companies' visibility and likely contributed to a certain slowdown in transaction volume.
- Despite the SNB’s low key interest rates in the third quarter of 2025, the market remained subdued, reflecting the continuing trade uncertainties. Towards the end of the year, a preliminary agreement with the United States reduced tariffs on Swiss goods to around 15%, partially improving the economic climate.
- The strength of the Swiss franc has steered the market towards transactions targeting high-quality assets, rather than a return to pre-2024 high volumes. In the first half of 2025, Swiss targets became more expensive for foreign acquirers, reinforcing this selective dynamic.
 (1)")
- In 2025, the proportion of transactions involving only Swiss companies increased compared with 2024, rising from 26% to 29%, as did the proportion of deals involving Swiss companies with foreign buyers (28% vs 33%)(1). This development shows the attractiveness of Swiss companies, linked in particular to the country's stability and the robustness of its currency.
- The mergers and acquisitions market in 2025 was dominated, in terms of transaction value (and only for transactions that were publicly disclosed), by the financial sector (particularly insurance), healthcare, and technology.
- In terms of volume, the consumer and distribution sector dominated in 2025, followed by the tech, telecoms, and media sector, marking a shift from 2024.

Source: Refinitiv, analyses Berney Associés
(1) The sample analysed includes transactions involving a Swiss target company and/or a Swiss acquirer. The transactions selected relate to acquisitions of shareholdings exceeding 30%. The transaction amounts presented relate solely to transactions for which information was available on Refinitiv at the date of publication of this report.
(2) Transaction Helvetia / Bâloise (insurance)
II. Synthesis sectoral at a glance«
The multiples presented below have been established according to the following criteria: listed companies; geographical sector (Switzerland and Western Europe). Low/non-representative values have generally been excluded from these analyses. (Source: Refinitiv).
EV (Enterprise Value): company value excluding free cash and/or debt.
EV/EBITDA transaction multiples for Swiss SMEs are generally lower (5x to 7x on average); these latter ones – which are quite numerous – are generally excluded from statistics (as transactional data is not published).
The sector variations presented below are based on median operating profit (EBITDA) values from the selected company panel.
Source: Refinitiv.
Energy sector
Median multiples in Switzerland and Western Europe over 5 years

Energy
Evolution of economic profitability in Switzerland and Western Europe over 5 years

Materials sector
Median multiples in Switzerland and Western Europe over 5 years

Materials
Evolution of economic profitability in Switzerland and Western Europe over 5 years

Industry sector
Median multiples in Switzerland and Western Europe over 5 years

Industry
Evolution of economic profitability in Switzerland and Western Europe over 5 years

Health sector
Median multiples in Switzerland and Western Europe over 5 years

Health
Evolution of economic profitability in Switzerland and Western Europe over 5 years

Non-essential consumer goods sector
Median multiples in Switzerland and Western Europe over 5 years

Non-essential consumer goods
Evolution of economic profitability in Switzerland and Western Europe over 5 years
")
Consumer staples sector
Median multiples in Switzerland and Western Europe over 5 years

Essential consumer goods
Evolution of economic profitability in Switzerland and Western Europe over 5 years

Financial sector
Median multiples in Switzerland and Western Europe over 5 years

Finance
Evolution of economic profitability in Switzerland and Western Europe over 5 years

Technology sector
Median multiples in Switzerland and Western Europe over 5 years

Technology
Evolution of economic profitability in Switzerland and Western Europe over 5 years

Service sector
Median multiples in Switzerland and Western Europe over 5 years

Services
Evolution of economic profitability in Switzerland and Western Europe over 5 years

III. Outlook
Evolving transactional multiples
1. (Temporary?) drop in multiples at the end of 2025
-
-
-
-
According to the Argos Index®, EV/EBITDA multiples reached 8.7x in Q3 2025, marking a notable decrease observed since Q3 2024.
The Argos Index® is a quarterly index that measures the valuation of mid-market SMEs.* not listed in the Eurozone, based on transaction multiples. Launched in 2006 by Argos Wityu and Epsilon Research, it presents the median of the historical EV/EBITDA multiple over the preceding six months.
-
-
-
-
-
-
- In the third quarter of 2025, company valuations in the mid-market sector reached a historically low level. A significant proportion of transactions are now occurring below 7x EBITDA, while very high multiples are becoming increasingly rare, likely reflecting some downward pressure on prices. It should be noted, however, that the EV/EBITDA transaction multiple for SMEs in Switzerland remains significantly lower (5x to 7x on average); these SMEs, which are very numerous, are generally excluded from statistics as transaction data is not published.
-
-
-
- The trade tensions imposed by the United States, international geopolitical uncertainties, as well as the tightening of credit conditions in Q3 2025 in Europe, have led to greater caution among buyers and sellers. This has resulted in tighter negotiations and, consequently, a decrease in the Argos Index's EV/EBITDA multiples in an uncertain economic context.
-
-
2. New opportunities
-
-
-
- Companies will step up strategic acquisitions to accelerate their digital transformation, integrate artificial intelligence, strengthen cybersecurity and meet ESG requirements.
-
-
-
- For 2026, many decision-makers anticipate an increase in the number of transactions and valuations, supported by lower interest rates and expectations of economic growth.
-
-
-
-
-
- High levels of dry powder** holdings by private equity funds in Europe and Switzerland constitute a significant capital reserve, ready to be invested. This availability of capital should support the mergers and acquisitions market in 2026.
-
-

Source: Argos Wityu. (05.01.2026). Argos Index® 3rd Quarter 2025.
Sources :
* mid-market: refers to medium-sized companies, with an enterprise value generally between €15 and €500 million.
**dry powder: refers to capital raised by investment funds that has not yet been invested and is available
Latest news
Business Intelligence comes to the World Cup
Four collaborators have built a near real-time scoreboard for the internal World Cup predictions. A project that perfectly illustrates the Berney Insights approach: making data readable, dynamic, and shared.
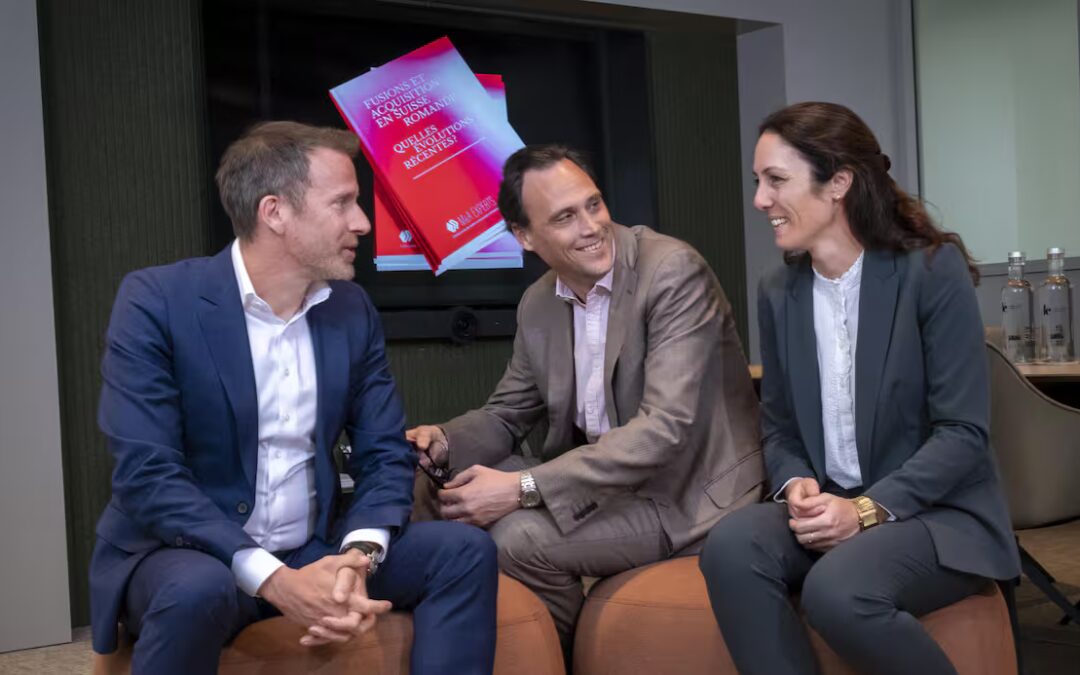
Raphaël Leveau co-authors a white paper on business succession in Switzerland
For the 5th anniversary of the Swiss Association of Business Transfer Experts, our partner Raphaël Leveau co-authored a white paper on the Swiss M&A market, featured in PME magazine.

Ofisa Berney Associés becomes Berney Associés Vaud
Ofisa Berney Associés becomes Berney Associés Vaud. This evolution is a continuation of the merger between the two entities and reflects a strengthened common identity.